 Matt Mulherin – [Applications Consultant]
Currently, AI or Artificial Intelligence is quite the buzzword. AI is defined as intelligence exhibited by machines or software. AI is growing leaps and bounds in the business world and AI investment increased by 300% in 2017 according to IDC. Deloitte reports 82% of organizations will be investing in AI by 2020. There are many levels of AI, some more advanced, costly, and complex than others. Many smaller organizations hesitate, and rightly so, to take the plunge into the newest, costly AI technologies. How do these organizations get started without having to invest too much time and resources into AI technologies?
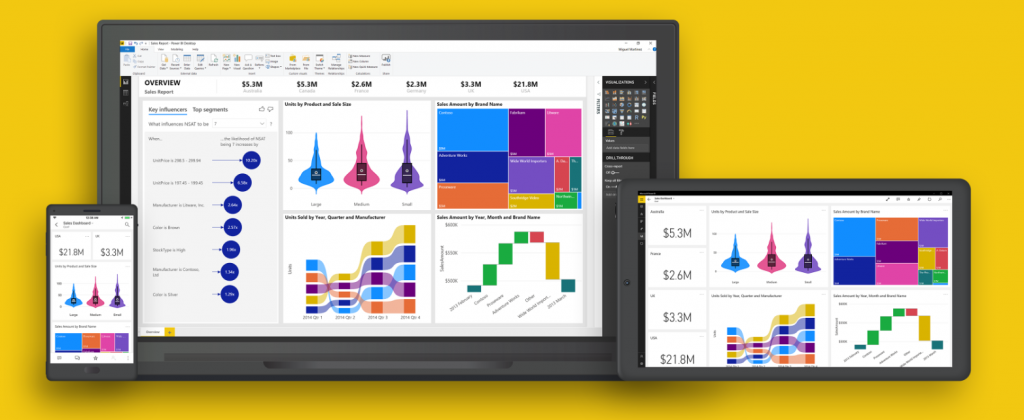
 Our answer is Microsoft Power BI, an affordable business analytics solution that visualizes data and allows you to share insights across the organization. It can connect to many data sources and bring data to life with interactive, live dashboards and reports. Power BI can integrate with Azure Machine Learning Services, which are a subset of AI, to analyze data and make future predictions about the business. Power BI is available as a SaaS option running in the Azure cloud or as an on-premises option as Power BI Report Server.
Even if you are not quite ready to go big with AI, your business will benefit greatly from Power BI because of its easy-to-use capabilities to create reports and dashboards to gain insight into your data. Different departments in an organization have different needs for the type of data, reports, and visualizations they use to monitor performance. For example, Finance might want to see visualizations around revenue, profitability, and expense management, while individuals in Operations have a need to see inventory performance and resource consumption trends.
The great news is that Power BI is affordable. You can sign up for a free account to give it a test drive or subscribe for $9.99 per month per user. There is a premium license available for capacity-based pricing. Compared to other tools it can be much more affordable to get started, providing you more time to get buy-in from the organization before investing too much up-front.

Power BI is a leader in the Gartner Magic Quadrant for Analytics and Business Intelligence Platforms. This is quite an achievement for only being in the market for 4 years, but Power BI is a cloud-based platform built using technologies from Microsoft that have been around for the last 20 years. It is an industry-leading product and can scale as your data analytics and AI practices grow within your organization.
Power BI Desktop is a free downloadable client desktop tool used to configure, model, and build visualizations and reports in Power BI. It is designed for a power user, someone with data and technical skills, but not necessarily programming skills. Power BI Desktop uses Excel like expressions called Data Analysis Expressions (DAX) for extending your data model for reporting purposes. No coding is required.
The process for getting started using Power BI is straightforward.
- Connect to your data using over 100+ built-in data source connectors
- Easily clean the data using the user interface options and load it into Power BI Desktop
- Shape the data to match your analysis and reporting needs using DAX
- Create relationships and enrich your data model with new calculated columns and metrics
- Create reports with dozens of customizable pre-built visualizations
- Publish the reports and datasets to the Power BI service for collaboration and consumption by others in your organization
As a consumer of Power BI, you choose datasets and fields you want in your reports, filter the data, build dashboards, share with others, use natural language to ask questions of the data, and view visualizations anywhere on your mobile device.
In the data culture we are currently living in, gathering data from multiple sources and analyzing it in order to clearly understand what story the data is telling can be a daunting task. Power BI enables you to easily connect, model, and then explore your data with visual reports so that you can collaborate, publish, and share.
Keller Schroeder can help you purchase, configure, model your data, and build visualizations that will change your data into insights using Microsoft Power BI. Gaining insights and telling a story with your data can be the first steps to utilizing AI in your business and modernizing your organization’s data strategy.
If you would like to learn more about Power BI, please reach out to our Applications Solutions Group to get started.


